Scotland · Community dispensing · 2024–2025
A small rise.
A consistent change.
Scotland dispensed 0.8% more SSRI items in 2025. Within this group of antidepressants, sertraline rose and citalopram fell in all 14 territorial dispensing areas.
See the medicines and places ↓The falling bars subtract from sertraline’s rise. The final bar shows the smaller net increase.
4,187,571 SSRI items in 2024 → 4,219,042 in 2025.
For primary-care and community-pharmacy teams interpreting dispensing patterns. These are prescription items, not people, diagnoses or evidence of patients switching medicines.
Reconciled with the competition extract ↗Our analysis · Six SSRI medicines
Two opposing changes dominate
The full six-medicine picture shows how the larger opposing changes leave a small net rise. A large percentage change can still represent relatively few items.
Change in items dispensed · 2025 minus 2024
Every medicine uses the same −40,000 to +80,000 item scale, with zero marked. Percentages beside names compare each medicine with its own 2024 item count. A large percentage change can still represent few items.
How did sertraline’s share of SSRI items change?
Sertraline’s share moved from 49.35% to 50.63%, an increase of 1.28 percentage points. Share measures composition, rather than the percentage change in a medicine’s own count.
Exact national medicine counts and changes
Source: our aggregation of the existing detailed PHS dispensing records, January 2024–December 2025. SSRIs: BNF 040303. Methods and reconciliation.
All 14 areas · One shared scale
Same direction.
Different sizes.
Sertraline rose and citalopram fell in every area. Compare the size of the changes on one fixed scale.
Percentage change in each medicine’s own item count · 2024 to 2025
Percentage changes use each medicine’s own 2024 count. Select an area name to update its exact counts below.
Why compare both percentages and item counts?
Sertraline rose 5.43% in the Western Isles (+437 items), compared with 2.32% in Greater Glasgow & Clyde (+11,613). The percentage describes change relative to each area’s starting count; the item difference describes its contribution to volume.
Geography is dispensing location, not patient residence or prescribing practice. Area differences do not establish differences in clinical need or care quality.
Exact regional item counts and percentage changes
Effect sizes · Area variation · Robustness
Modest changes.
Consistent directions.
The median area change was +2.78% for sertraline and −3.53% for citalopram. The plot shows the spread across all 14 areas, with each area weighted equally.
The distribution of area changes · 2024 to 2025
Each dot is an area; the line spans the observed minimum and maximum. The shaded band is the IQR and the vertical mark is the median. These describe geographic spread, not confidence intervals or patient outcomes.
Exact medians, ranges and middle 50%
Scroll the table sideways to see every column.
Does the pattern hold up?
12 of 12 matched monthsSertraline’s national share of SSRI items was higher in every month of 2025 than in the corresponding month of 2024. Citalopram’s share was lower in every month.
168 checks per medicineOmitting each calendar month from both years preserved the sertraline increase in 168/168 area comparisons, and the citalopram decrease in 167/168. The one exception is explained below.
14 of 14 areas after day adjustmentAllowing for 366 days in 2024 and 365 in 2025 leaves both annual directions unchanged across all areas. This does not adjust for working days or payment timing.
The omission checks overlap; they are not 168 independent observations.
Does the pattern depend on one particular month?
Removing each matched calendar month from both years leaves sertraline’s increase in all 168 area comparisons. Citalopram’s decrease remains in 167 of 168 comparisons. Dumfries and Galloway has one reversal after omitting a month. The headline therefore describes the complete calendar years; it is not an uninterrupted monthly decline or proof of a universal underlying process.
These are descriptive sensitivity checks. Read the findings and limitations.
Does the leap year change the result?
Dividing 2024 items by 366 calendar days and 2025 items by 365 leaves the sertraline rise and citalopram fall in all 14 areas. National changes in items per calendar day are +3.65% and −3.58%, respectively. This simple arithmetic adjustment does not account for working days, payment timing, population or clinical need.
For primary-care and community-pharmacy teams
Use the pattern to ask a better local question
These records identify dispensing patterns, not patient switches, treatment benefit or unequal access. Prescribing records and clinical context are needed to investigate explanations.
Compare an area ↑Sources, interpretation and checks
Data coverage and the supplied competition extract
The supplied community-prescribing extract establishes the wider chapter totals. In 2025 its nervous-system chapter contains 21,658,856 items. Reconciled detailed records identify 8,585,514 antidepressant items (39.6%); 4,219,042 of those are SSRIs. All antidepressants rose 1.4% from 2024; this story narrows the analysis to SSRIs.
The comparison covers calendar 2024 and 2025, all ages, on a dispensing-location basis. The whole nervous-system chapter is not a mental-health total. Supplied competition extracts · PHS detailed dispensing data.
How the analysis was checked
All 24 monthly dispenser files for 2024–2025 were analysed. Detailed records reproduced the supplied extract across 621,942 pharmacy/month/chapter combinations, with zero item mismatches and no cost differences above 2p. Medicine counts were summed across brands, strengths and formulations. Citalopram chemical codes 0403030D0 and 0403030Z0 were combined.
All six national SSRI changes sum to +31,471. The 14 areas reproduce national sertraline and citalopram counts. The annual regional directions and the matched-month omission checks were recalculated from the existing records. Full original extraction audit · Current story validation.
2024 contained 366 days and 2025 contained 365. Counts are not adjusted for working days, payment timing or prescription intervals. Smaller-period comparisons can differ. Descriptive patterns do not establish causation or statistical significance.
Statistical methods and exploratory p-values
Exploratory p-values across all six SSRIs
The exact sign test asks whether increases and decreases are balanced across areas. Its null model assumes that each non-tied area is independent and has a 50% probability of an increase. Each area contributes one sign, regardless of item volume.
These p-values depend on the model. The 14 areas share national and regional influences, so independence may not hold. This is an exploratory calculation after examining the data. It does not establish cause, clinical importance or the probability that the findings are due to chance.
Scroll the table sideways to see the p-values.
Two-sided exact tests; ties excluded. Holm adjustment covers these six SSRI tests. It does not repair dependence between areas or account for earlier searches for a story. No significance stars or threshold-based verdicts are used.
Assumptions and confidence intervals
Annual area counts were paired between 2024 and 2025. The test uses only whether each difference is positive or negative. For 14 non-tied changes all in one direction, the two-sided p-value is 2 ÷ 2¹⁴ = 0.0001220703125. Holm adjustment across the six tests gives 0.000732421875 for both sertraline and citalopram.
The independence assumption matters: under a hypothetical model with only seven independent signs all in one direction, the raw p-value would be 0.015625; with four it would be 0.125. These examples are not alternative groupings calculated from our records. They illustrate why the p-values cannot settle how strong the real-world evidence is.
These records cover the full observed set of 14 areas. Their recorded totals and empirical median/IQR do not have sampling uncertainty from a random sample. Patient-level intervals would require a justified model and information about repeated items and treatment histories. We therefore show observed spread and sensitivity checks, without item-level confidence intervals.
Full statistical methods and results · Download calculated statistics (JSON). Method references: exact binomial tests, Holm correction, and the ASA principles for interpreting p-values.
What an item can and cannot tell us
An item is not a unique person, tablet, treatment course, dose or new diagnosis. Antidepressants can have mental-health and physical-health uses. No diagnoses, ages, indications, individual treatment histories, self-harm events or outcomes were accessed. The all-area result cannot identify people moving from citalopram to sertraline.
The story describes reimbursed community dispensing-location records. It is not a measure of antidepressant need, prevalence or quality of care. NHS information on antidepressant uses.
Could costs or prescribing guidance explain the changes?
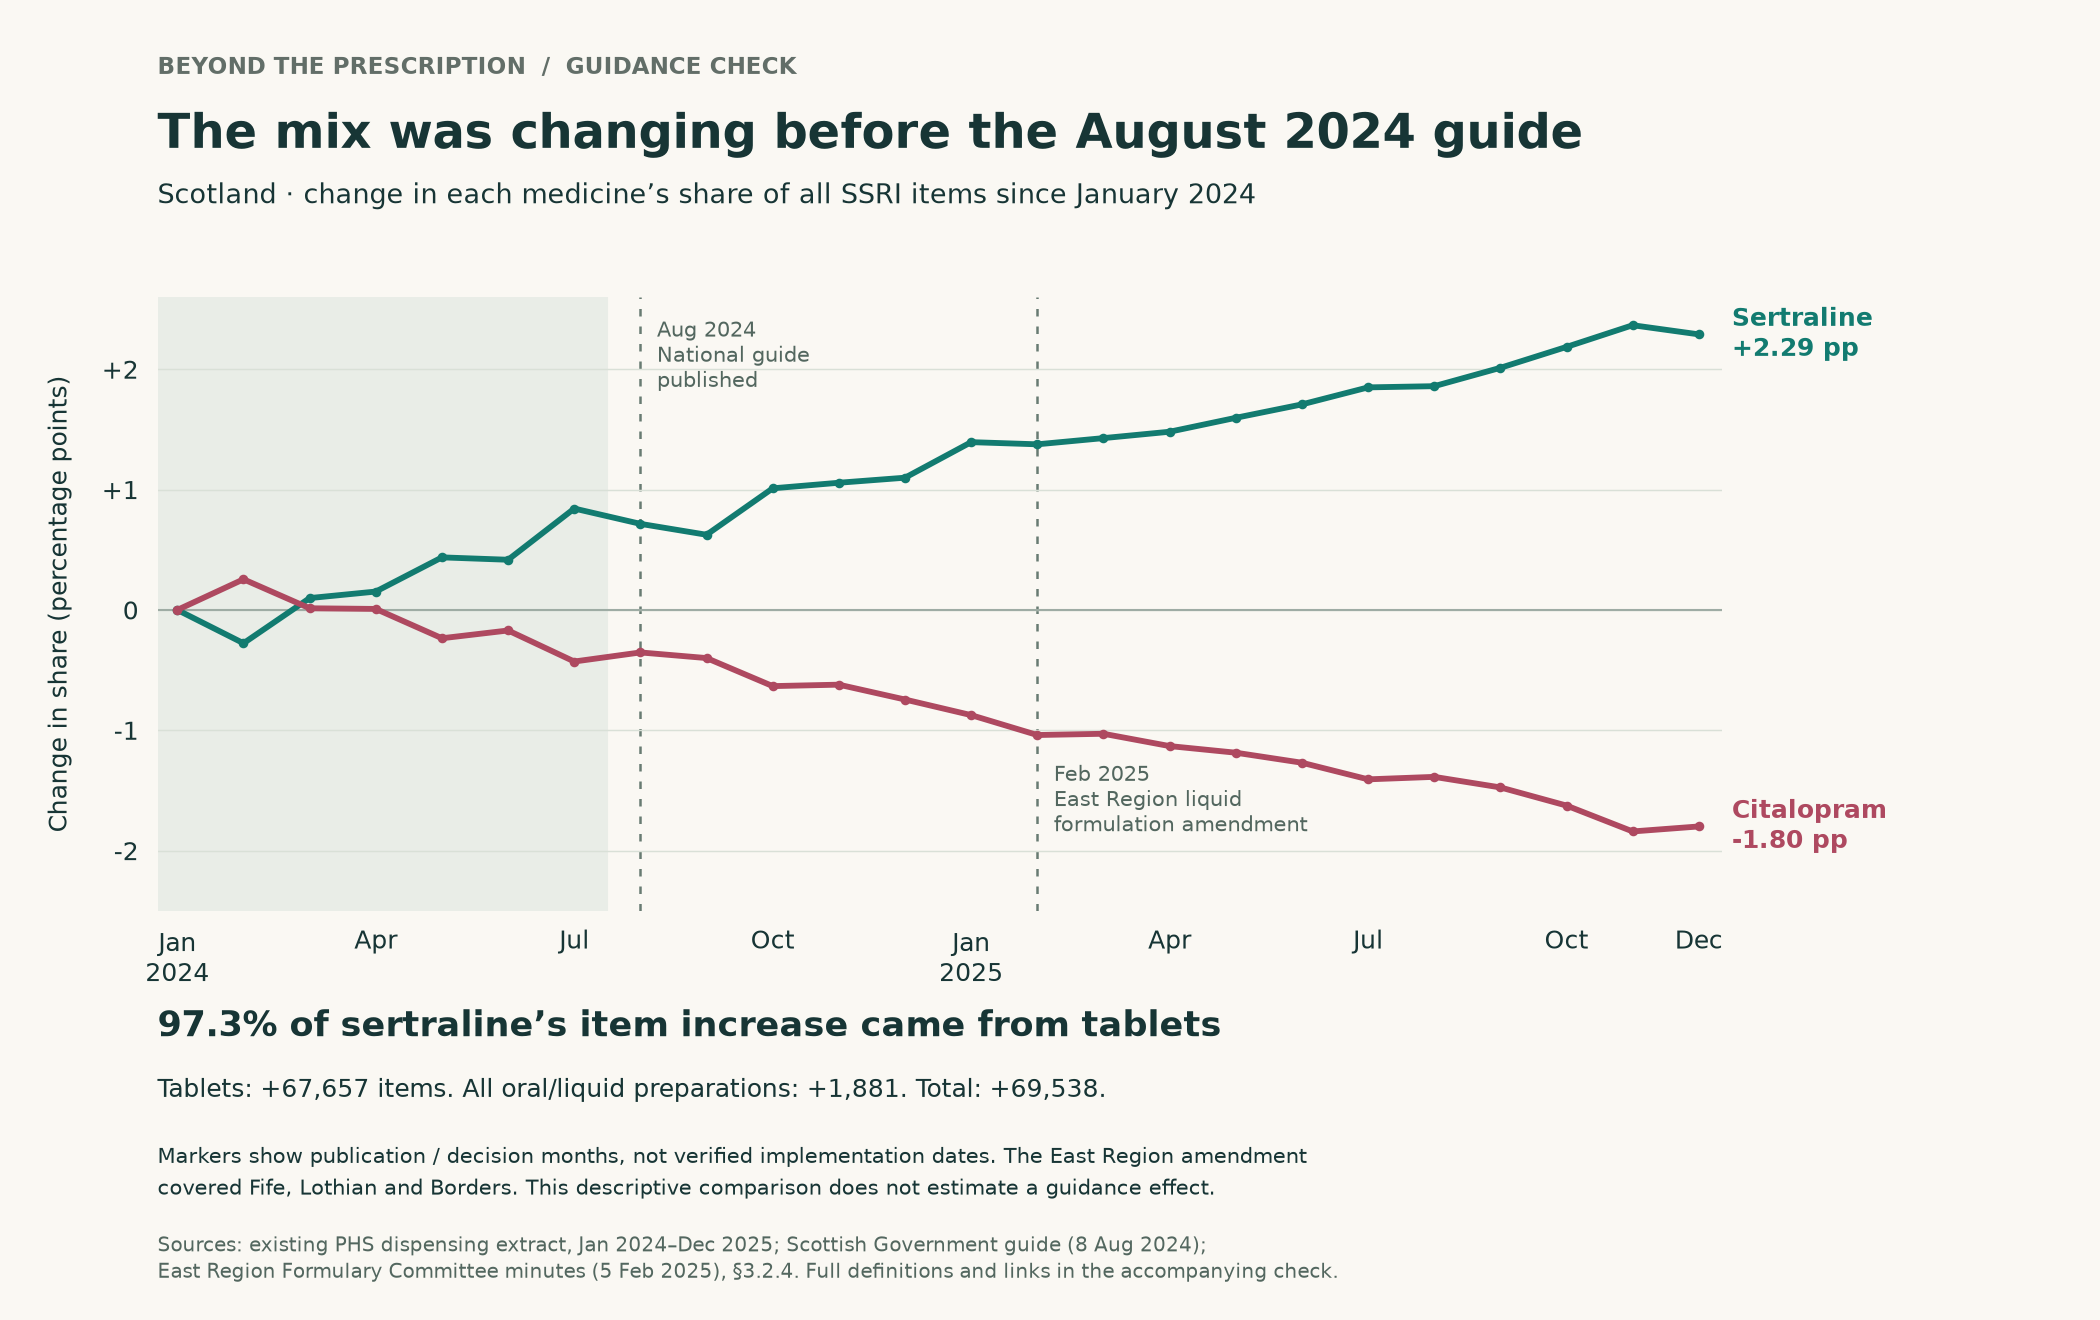
Scotland’s national antidepressant guide was published on 8 August 2024. It promotes reviews and individual treatment decisions, with no blanket instruction to replace citalopram with sertraline. The monthly mix was already moving in these directions before publication. However, publication is not the same as the start of clinical influence: the guide describes contributors already doing prescribing-improvement work.
We cannot establish whether guidance reinforced an existing trend or influenced decisions before publication. Older local preferences and a February 2025 East Region liquid-formulation amendment supply context, but do not identify the cause of the national pattern. Dated guidance check and limitations · Monthly timing chart.
Our existing 2025 records give mean gross ingredient costs of £3.24 per sertraline item and £2.04 per citalopram item. These averages mix strengths, quantities and formulations; they are not like-for-like treatment costs, net NHS expenditure or evidence of a cost-driven decision. Cost check and limits.
Provenance and AI use
Sources: the competition’s supplied community-prescribing extract and the detailed PHS monthly dispensing records already analysed for this project. No additional patient dataset was added to build this story. Formulary guidance provides explanatory context only.
AI assisted source discovery, Python aggregation and reconciliation, sensitivity analysis, writing, HTML/CSS/JavaScript and PDF code, packaging, hosting and browser checks. The creator directed the focus and revisions. No patient-level clinical records were accessed; no reader responses or clinical endorsement were generated. Independent visualisation under the Open Government Licence.